Home >> Information - Mean, Mode, Median & Range
Coursework Notes - Information
mean |
The Mean
This is the average value for a set of single data values. It is calculated by adding up all the values and dividing by the number of values.
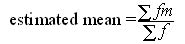
The Mean for grouped data
This is similar to some extent with the median for grouped data. No exact value can be found. It can only be estimated.
method:
|
Example
The table represents the heights of pupils within a school.
Using the data calculate the mean value.
class (height - h) cm |
mid value (m) |
frequency (f) |
mid value x frequency (fm) |
70 |
72.5 |
2 |
145 |
75 |
77.5 |
7 |
542.5 |
85 |
87.5 |
21 |
1837.5 |
95 |
97.5 |
15 |
1462.5 |
105 |
107.5 |
12 |
1290 |
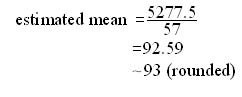
total no. results |
57 |
5277.5 |
The Mode & Modal Class
For single values in a set of data, the mode is simply the value with the highest frequency.
For grouped values in a set of data, the modal class is simply that class/group with the highest frequency.
The Median
The median is the middle value of a set of data.
1__3__4__5__9__10__21__ 32__45
The median is therefore 9
The Median for 'grouped values'
For grouped values finding the median is more difficult. It cannot be found exactly, but is estimated using 'interpolation', which is essentially an educated guess.
method:
1. Find which result is in the middle by dividing the total number of results in half. For example if there are 91 results , the median is result number 46(45.5 rounded up).
2. Identify the modal class(the group of values/results) that contains the median.
3. Count how many numbers there are in this group.
4. Identify the frequency for the group.
5. Find the order of the median within the group.
6. The median can be calculated as being the first number in the group plus a proportion of the number of results in the group.
![]()
Example
The table represents the heights of pupils within a school.
Using the data calculate the median value.
class (height - h) cm |
class width
|
frequency (f) |
70 |
5 |
2 |
75 |
5 |
7 |
85 |
5 |
21 |
95 |
5 |
15 |
105 |
5 |
12 |
total no. results |
57 |
Since there are 57 values/results, the median occurs at position 28.5, ie. 29th to the nearest whole number.
This means that the median is the 29th value.
There are 2 values in the region 70 ![]() h < 75.
h < 75.
There are a further 7 values in the region 75 ![]() h <80.
h <80.
So the median lies at the 20th value within the range 85 ![]() h <90 . This group has 21 values in it.
h <90 . This group has 21 values in it.
note: (9 + 20 = 29)
There are 5 numbers in the group.
The first number in the group is 85.
Using our equation:
![]()
![]()
median = 85 + 4.76 =89.76 ~ 90(rounded)
Range of values
This is the spread of values, from the lowest to the highest.
[ About ] [ FAQ ] [ Links ] [ Terms & Conditions ] [ Privacy ] [ Site Map ] [ Contact ]