Home >> Information - Cumulative Frequency
Coursework Notes - Information
introduction |
Introduction
Frequency is used to describe the number of times results occur.
On the other hand, cumulative frequency is a 'running total'.
It is the sum of frequencies moving through the data.
Example - A survey was done to look at how many TV's there were in a household.
no. of TV's |
frequency |
cumulative frequency |
|
0 |
4 |
4 |
4 |
1 |
15 |
4+15 |
19 |
2 |
18 |
4+15+18 |
37 |
3 |
7 |
4+15+18+7 |
44 |
4 |
2 |
4+15+18+7+2 |
46 |
The definition of the median is that particular value half way through the data.
If the cumulative total of frequencies is 46, then the median is the 23 rd. value.
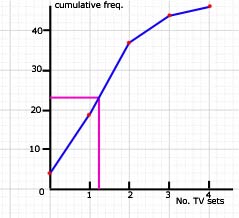
So the median is 1(nearest whole number).
Where there are lots of values, say more than 10, the data is best presented as 'grouped data'.
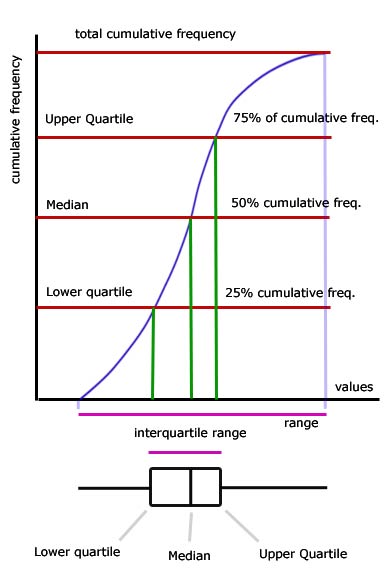
Quartiles
The upper quartile is the particular value 3/4 through the cumulative frequency.
The lower quartile is the particular value 1/4 through the cumulative frequency.
In the example given above:
upper quartile = 0.75 x 46 = 34.5 (rounded to 36) - this gives a value close to 2
lower quartile =0.25 x 46 = 11.5 (rounded to 12) - this gives a value close to zero
note: values are the readings along the bottom of a cumulative frequency graph
Ranges
The interquartile range is the difference between the lower and upper quartiles.
interquartile range = 34.5 - 11.5 = 23
The interquartile range is a measure of how spread out data is.
With reference to products( eg the shelf-life of foods) a small value for the interquartile range means a more accurate result.
Box & Whisker Plot (Box Plot)
The plot is derived from a cumulative frequency graph and shows the range of data , the interquartile range, and where the quartiles are in relation to the median.
[ About ] [ FAQ ] [ Links ] [ Terms & Conditions ] [ Privacy ] [ Site Map ] [ Contact ]