Home >> Algebra - Graphs - Functions
Coursework Notes - Algebra
y= f(x) + k |
|||
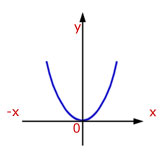
The function y= f(x) + k
![]()
![]()
![]()
![]()
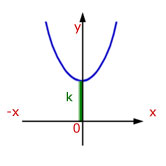
When x = 0, y = k . So the curve is moved(translated) by 'k' in the y-direction.
In vector terms the translation of the curve is ![]()
![]()
The function y= f(x + k)
![]()
![]()
![]()
![]()
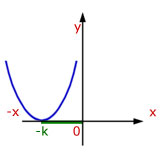
This is best understood with an example.
Let k be equal to some number, say 3. Adding 3 into the original equation, we have:
So the curve moves -3 to the left, to where y=0. That is -k to the left.
In vector terms the translation of the curve is ![]()
![]()
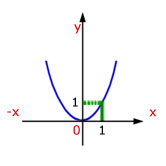
The function y = kf(x)
![]()
![]()
![]()
![]()
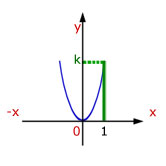
In our example, y increases by a factor of 'k' for every value of x.
Example - let k=5
So for each value of x, the value of y is 5 times its previous value. The curve is stretched in the y-direction by a factor of 5. That is by a factor of k.
The function y= f(kx)
![]()
![]()
![]()
![]()
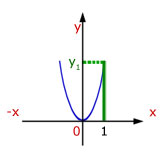
In the above, when x=1, y=1. However, in the second function when x=1, y is a higher value.
Look at the example below for x=1 and other values of x.
Remember, in this function the constant 'k' multiplies the x-value inside the function.
Example #1 - let k=4
You will notice that the y-value jumps by a factor of 16 for each increasing x-value. The y-value increases by a factor of 4 squared.
With more complicated functions the value of y for a given value of x, increases once more, narrowing the curve in the x-direction(or stretching in the y-direction).
Example #2 - a more complicated function with k=4
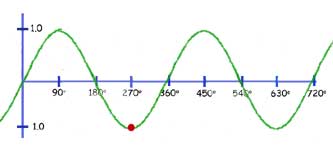
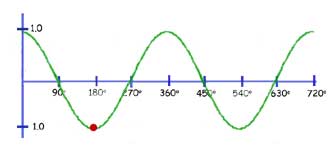
The function y= sin(x+k)
Here the graph is translated by the value of k, to the left
So when k=90 deg. The curve moves horizontally 90 deg. (looking at the red dot, from 270 deg. to 180 deg.)
![]()
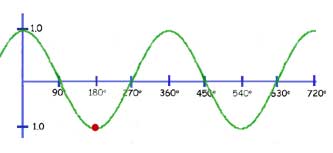
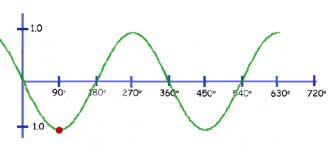
The function y= cos(x+k)
This is exactly the same as for the sine function.
The graph is translated by the value of k, to the left
So when k=90 deg. The curve moves horizontally 90 deg. (looking at the red dot, from 180 deg. to 90 deg.)
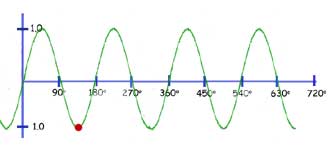
The function y= sin(kx)
Here the graph is squeezed horizontally(concertinered) by a factor of k.
In our example below, k = 2. So one whole wavelength of 360 deg. is reduced to 180 deg.
Conversely you may think of any value of x being halved(red spot reading changes from 270 deg. to 135 deg)
![]()
![]()
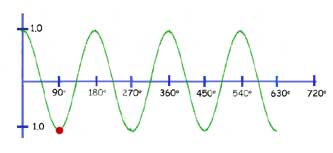
The function y= cos(kx)
As with the previous function, the graph is squeezed horizontally(concertinered) by a factor of k.
In our example below, k = 2. So one whole wavelength of 360 deg. is reduced to 180 deg.
Conversely you may think of any value of x being halved(red spot reading changes from 180 deg. to 90 deg).
![]()
![]()
[ About ] [ FAQ ] [ Links ] [ Terms & Conditions ] [ Privacy ] [ Site Map ] [ Contact ]