Home >> Information - Histograms
Coursework Notes - Information
block graphs |
Block graphs
As a comparison you may wish to revise 'block graphs'(in 'representing data') before going on to study histograms.
Grouped Data (Grouped Frequencies)
To understand frequency density and it's role in histograms, you need first to appreciate the meaning of a number of terms relating to grouped data:
Example
height(cm) |
71-75 |
76-80 |
81-85 |
86-90 |
91-95 |
frequency |
5 |
17 |
21 |
15 |
2 |
class boundaries are the exact values(for each set of grouped data) where one set of values ends and the other begins.
In our example, the class boundaries are: 75.5 __80.5__ 85.5__ 90.5
You must appreciate that these numbers are the 'deciders' as to which group data is placed.
For example 75.45 would be rounded down to 75 and be placed in the first group, but 75.55 would be rounded up an placed in the second.
class width is the width of each block of values(not frequencies).
In our example(above) height 71-75 gives a class width of 5 and NOT 4 (75-71). There are 5 numbers in the group 71 72 73 74 75 .
grouping using inequalities The values are grouped according to an inequality rule.
mid-interval values are useful in estimating the 'mean' of a set of grouped data. This is dealt with in detail in the topic 'mean, mode and median' here.
Frequency Density
The frequency density is a the frequency of values divided by the class width of values.
Histograms
The area of each block/bar represents the total of frequencies for a particular class width.
The width of the block/bar(along the x-axis) relates to the size of the class width. So the width of a block/bar can vary within a histogram.
The frequency density is always the y-axis of a histogram.
Histograms are only used for numerical continuous data that is grouped.
Example Here is a table of data similar to the last one but with values of height grouped differently using inequalities.
note: because the class is grouped using inequalities, one 'equal to and greater' and the other 'less than' , the class width is a straight subtraction of the two numbers making up the class group.
|
class (height - h) cm |
class width
|
frequency
(f) |
frequency density
|
65 |
10 |
2 |
2/10 = 0.2 |
75 |
5 |
7 |
7/5 = 1.4 |
80 |
10 |
21 |
21/10 = 2.1 |
90 |
15 |
15 |
15/15 = 1.0 |
105 |
5 |
12 |
12/5 = 2.4 |
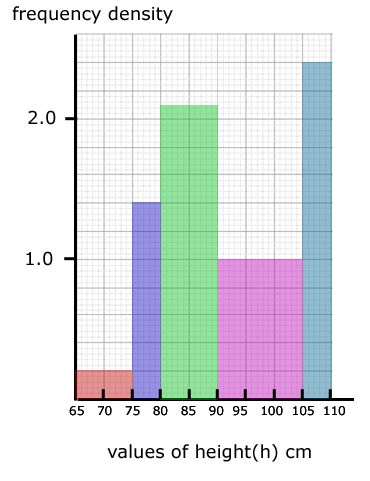
Significance of area
The area on a histogram is important in being able to find the total number of values/individual results in the data.
In our histogram(from the table), the 65 to 75 block represents 2 children, the 75 to 80 block represents 7 children, and so on.
So one block square represents one child.
If we count the square blocks in the whole sample we get 57 - the sum of all the frequencies i.e. the total number of children taking part - the number of individual results.
[ About ] [ FAQ ] [ Links ] [ Terms & Conditions ] [ Privacy ] [ Site Map ] [ Contact ]